Query Manager
Note: This feature is available in Enterprise and Team editions only.
Table of contents
Overview
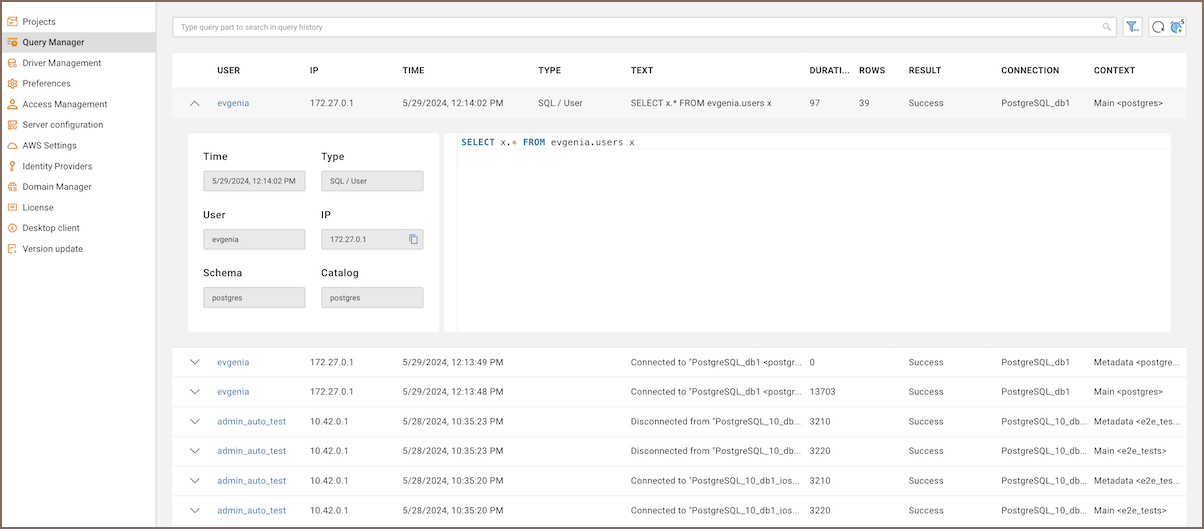
The Query Manager in CloudBeaver is an administrative tool that allows only administrators to monitor and manage all queries executed within the system. It provides comprehensive details on the execution statistics, such as duration, number of rows affected, and the outcome of each query.
To access the Query Manager, navigate to Settings -> Administration and select the Query Manager tab.

The following table describes each field in the Query Manager:
| Field | Description |
|---|---|
| User | Displays the name of the person who executed the query. |
| IP | Indicates the IP address from where the query was initiated. |
| Time | Shows when the query was executed. |
| Type | Identifies whether the query was initiated by a user or generated by the system. |
| Text | Contains the SQL code that was executed. |
| Duration | Measures how long the query took to complete, in milliseconds. |
| Rows | Counts how many rows were affected or returned by the query. |
| Result | Describes the outcome of the query, such as "Success" or any errors that occurred. |
| Connection | Specifies which database connection was used to execute the query. |
| Context | Provides additional information about the environment or session in which the query was executed. |
| Schema | Indicates the database schema used for the query. |
| Catalog | Represents the database catalog being accessed during the query. |
Tip: In the Team Edition, supervisors also have the ability to use the Query Manager to monitor their team’s queries. For more detailed information on the supervisory functions within the Query Manager, refer to the article on Teams in Team Edition.
The Query Manager offers several features to enhance usability:
Search Functionality: Use the Search function to locate specific queries by entering SQL text in the Search field above the table.
Refresh Query Manager: Manually update the data displayed in the Query Manager by clicking the Refresh button
 located in the toolbar.
Auto Refresh: The Query Manager can automatically update the query list. You can disable this feature by toggling the Auto-Refresh button
 in the toolbar. This
setting is adjustable, for information on how to customize it, see the section on Auto Refresh.
Query Manager Options
The Query Manager offers a range of customizable settings that allow administrators to tailor the view and behavior
according to their specific needs. To access these settings, click the Query Manager Options
button ![]() .
.
Here is a detailed breakdown of each configurable option available through this feature:
Query types
You can filter which types of queries are displayed in the Query Manager by selecting or deselecting the following options:
| Option | Description |
|---|---|
| User queries | Show all queries directly executed by users. |
| Filtered user queries | Show user queries that meet specific criteria. |
| User scripts | Show batches of queries executed as scripts. |
| Utility functions | Show system-level utility function calls. |
| Metadata read | Show queries that read database metadata. |
| Metadata write (DDL) | Show queries that modify database structure. |
| Query status | Allows to filter queries based on their execution status. The available options are: |
| All: Displays all queries regardless of their execution outcome. | |
| Fail: Shows only the queries that have failed. | |
| Success: Displays only the queries that have executed successfully. |
Object types
Control visibility of different system object types involved in the queries:
| Option | Description |
|---|---|
| Sessions | Include queries related to user sessions. |
| Transactions | Include queries that are part of transactions. |
| Queries | Include individual query executions. |
Filter by date
Specify the date range to view queries:
- From: Start date and time for the filter.
To: End date and time for the filter.
Filter by users
You can filter the displayed queries by specific users. Use the search field to find and select the desired users to tailor the display of queries according to your needs.
Filter by drivers
This feature enables you to filter queries based on the database drivers. Search for and select the drivers that you are interested in to narrow down the results of displayed queries.
Filter by Projects
Note: This feature is available in the Team Edition only.
You can filter the displayed queries by projects. This option allows you to search for and select the projects that are relevant to the queries you are interested in.
Sorting and Settings
Adjust how query results are sorted and displayed:
| Option | Description |
|---|---|
| Sorting by | Choose the attribute to sort the queries by (available options: User, Date, Driver, Query text). |
| Desc | Check this to sort in descending order. |
| Row Count | Set the number of queries to display per page. |
Auto Refresh
Configure automatic refresh of query information:
| Option | Description |
|---|---|
| Enabled | Check this to enable auto refresh every few seconds. |
| Interval (seconds) | Set how often the Query Manager updates. |
| Stop on error | Check this to halt auto refresh if an error occurs. |
Restore defaults
To restore the default settings, press the Restore Defaults button at the bottom of the Query Manager Options window.
