Query Execution Plan
Table of contents
Execution Plan
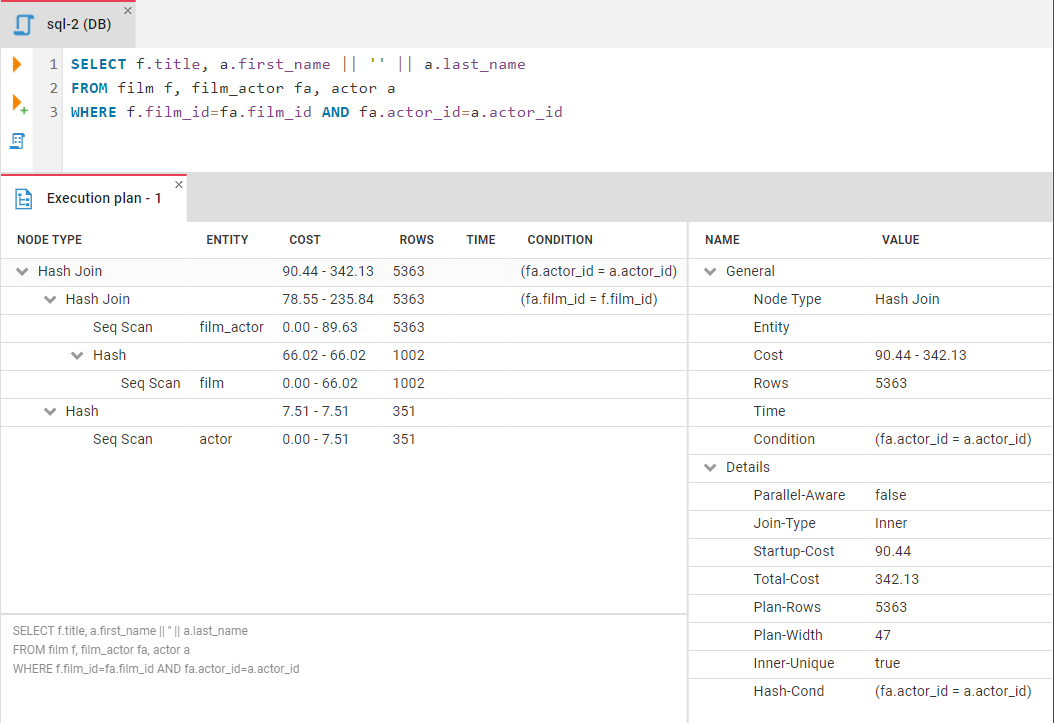
If a database driver supports the visualization of the execution plan, you can see the execution plan of the query by pressing Ctrl+Shift+E or clicking the Explain execution plan button  on the main toolbar. The execution plan command generates a query execution tree as one of the result tabs and is convenient in estimating if the query/script is quick/optimal enough.
You can click the rows of the execution plan to see their details (statistics) in the panel to the right of the plan.

