Dashboards
Note: This feature is available in Community, Enterprise, Ultimate and Team editions only.
Table of contents
Overview
Dashboards tool allows DBAs and programmers to quickly identify performance, disk space issues, the number of connections, and other important KPIs associated with a single database connections.
By default, DBeaver comes equipped with predefined charts sets for several popular databases. These include:
| Database | Predefined charts |
|---|---|
| Exasol | Connections, User activity |
| MySQL | InnoDB data, InnoDB memory, Key Efficiency, Queries, Server sessions, Traffic |
| Oracle | CPU usage, Global Query Stats, IO Stats, Memory usage, Memory usage by components |
| PostgreSQL | Block IO, Server sessions, Transactions per second |
In addition to these predefined charts, DBeaver also supports the creation of custom charts. For more information on customizing a dashboard panel, refer to the Managing Dashboards section.
Dashboard Types
You can create and open two types of dashboards: Connection dashboards and Project dashboards.
Connection Dashboards
Connection dashboards are specific to individual database connections. These dashboards allow you to monitor performance, disk space, the number of connections, and other critical metrics related to the connected database. Any changes or customizations made to a connection dashboard are temporary and specific to the session of the database connection.
For instructions on managing dashboards, see the Managing Dashboard panel section.
Project Dashboards
Project dashboards can include web-based dashboards and are saved within the active Project.
For instructions on adding and configuring these dashboards, refer to the Managing web-based dashboards section.
Managing Dashboard panel
The Dashboards panel aggregates a collection of real-time displays that update continuously. Each display consists of
ongoing SQL SELECT queries and dynamically generated charts, ensuring that data visualizations are always current.
Opening Dashboard panel
To open the Dashboards panel:
- Press the Open Dashboard button
 on
the top toolbar. The default configuration of the dashboards panel for the current database connection will appear.
Note The toolbar is customizable. For further information, refer to Toolbar Customization article.
- You can also right-click a connection in Database Navigator, then navigate to Tools -> Open Dashboard, or use the keyboard shortcut Ctrl+Alt+Shift+B to open the Dashboards panel.
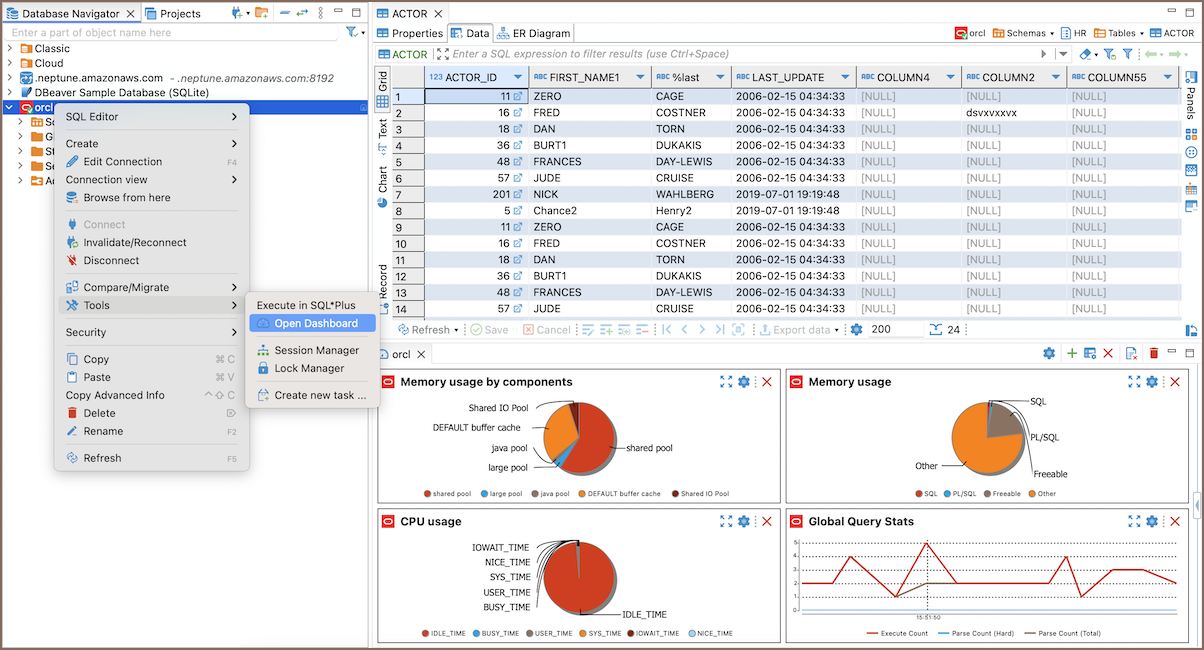
Once you open the Dashboards panel, the following controls are available on the toolbar:
| Name | Icon | Description |
|---|---|---|
| Settings | Opens the dashboard's configuration. | |
| Add chart | Opens a window where you can select which chart to add to the dashboard. | |
| Show charts catalog | Opens the side menu displaying available charts. | |
| Remove chart | Removes a chart from the dashboard panel. | |
| Reset dashboards | Restarts the chart's calculations. | |
| Delete dashboards | Deletes the Dashboard panel. Default dashboards cannot be permanently deleted and will be restored automatically if removed; however, custom dashboards, once deleted, must be manually recreated. |
Adding charts
To add a chart to the Dashboards panel:
Press the Add chart button
 on the Dashboards panel's toolbar,
choose one of the charts from the list of available charts, and press Add button or double-click on it, or
press Enter.
on the Dashboards panel's toolbar,
choose one of the charts from the list of available charts, and press Add button or double-click on it, or
press Enter.You can also right-click in any place of the Dashboards panel and then select the Add chart option.
Alternatively, press the Show charts catalog button
 on
the Dashboards panel's toolbar to open the side menu displaying available charts. From this menu, you can add a chart
to the dashboard by dragging it to the Dashboard panel, double-clicking on it, or press Enter.
Removing charts
To remove a chart from the Dashboards panel:
- Click on the chart you want to remove and press the Remove chart
button
 on the Dashboards toolbar.
 - Press the Remove chart button
 located on the chart panel's toolbar.
 Select the Remove chart option from the chart's context menu.
Resetting charts
If you want to restart a chart's calculations, you can reset it.
To reset a chart:
- Right-click on the chart and select the Reset dashboards
option
 .
. Left-click on the chart and press the Reset dashboards button on the chart panel's toolbar.
Changing chart representation
To adjust chart representation settings:
- Right-click on a chart and select the Settings menu option
 on the Dashboards toolbar.
 - Press the Settings button
 located on the chart panel's toolbar.
Then, in the opened dialog, change the parameters you want.
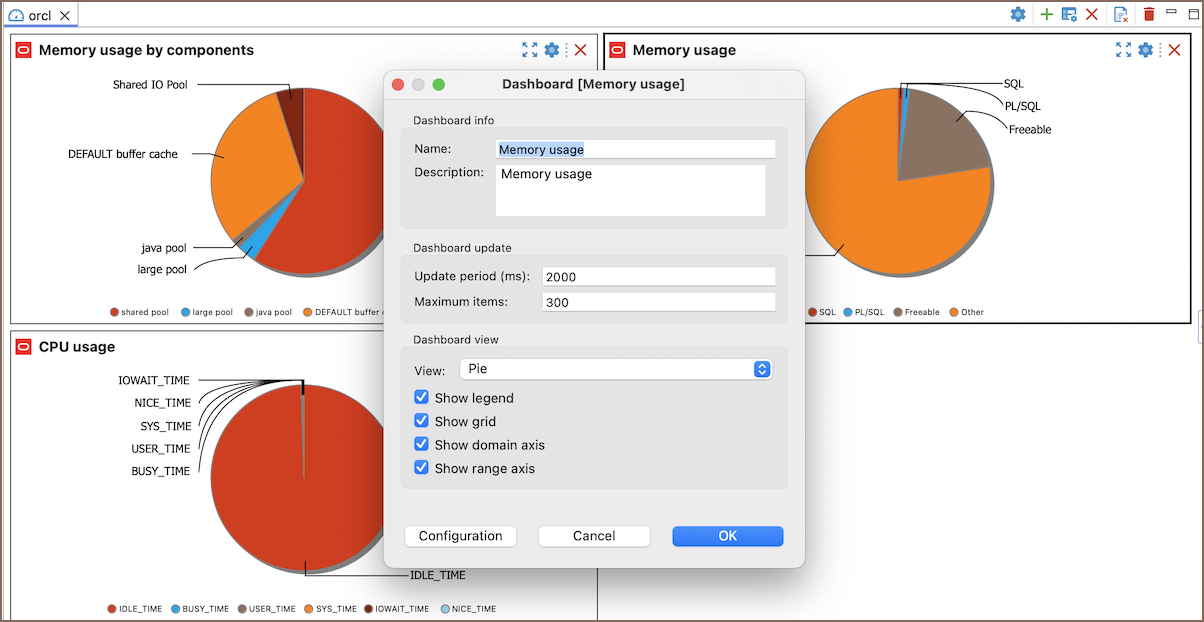
| Parameter | Description |
|---|---|
| Name | Defines the name of a chart. |
| Description | Defines the chart's description. Use this field to make it easy to understand what kind of information the chart represents. |
| Update periods(ms) | Defines how often chart's rendering should be updated. The default value is 1000 ms. |
| Maximum items | Defines the maximum number of fetched items. The default value is 300. |
| View | Defines the visual representation of the chart. The following options are available: Bar, Pie, Time series. |
| Show legend | If this check-box is selected, the legend will be displayed on the chart. |
| Show grid | If this check-box is selected, the grid will be displayed on the chart. |
| Show domain axis | If this check-box is selected, the domain axis will be displayed on the chart. |
| Show range axis | If this check-box is selected, the range axis will be displayed on the chart. |
Adjusting chart configuration
To adjust a chart's configuration settings:
- Right-click on a chart and select the Settings menu option
 on the Dashboards toolbar.
 - Press the Settings button
 located on the chart panel's toolbar.
in the opened dialog box, press the Configuration menu option.
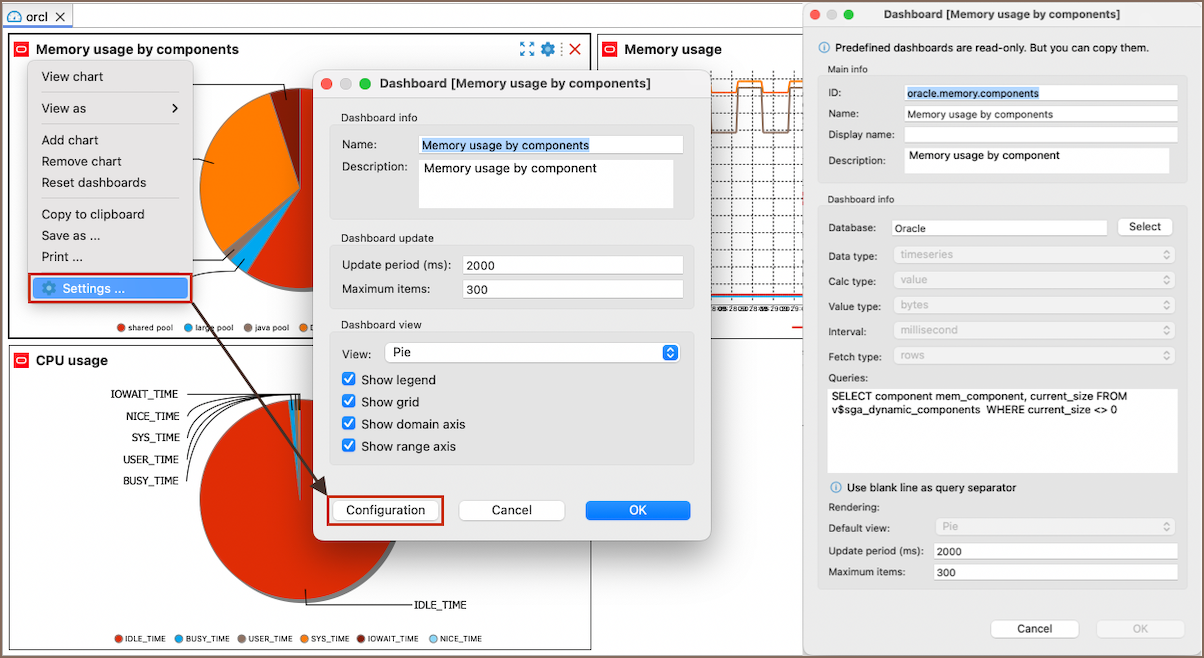
The following chart parameters can be configured:
| Parameter | Description | Available values |
|---|---|---|
| ID | Unique identifier for the chart. This is typically a structured string. | |
| Name | The name of the chart, which describes its function or the data it displays. | |
| Display Name | A user-friendly name for the chart that can be displayed in the user interface. | |
| Description | A brief explanation of what the chart displays, including the type of data and its use case. | |
| Database | Specifies the type of database connected to the chart. | |
| Data type | The nature of data used in the chart, which indicates continuous data points over time. | timeseries, statistics, provided |
| Calc type | The calculation type for data processing, which indicates direct value use without derivatives. | value, delta |
| Value type | The data unit measure, useful in contexts like memory usage. | decimal, integer, percent, bytes |
| Interval | The time interval for data refresh or update, indicating rapid data refresh cycles. | millisecond, second, minute, hour, day, week, month, year |
| Fetch type | Method of data retrieval, indicating row-wise fetching of data. | columns, rows, stats |
| Queries | SQL query used to fetch data for the chart, should correctly reflect conditions and targets specific data. | |
| Default view | Default visual representation style of the chart, which provides a pie chart of the data. | Bar, Pie, Time series, Browser |
| Update period (ms) | Frequency of chart updates in milliseconds, indicating how often the chart data gets refreshed. | |
| Maximum items | The maximum number of data points or items to display at any given time on the chart. |
Note: Predefined charts are read-only and cannot be re-configured, but you can copy them and use them as templates to create new charts with any query and other settings. To learn about creating new charts, see the Managing charts section.
Setting connection preferences
By default, if there is no active connection to the database and you open its Dashboards panel, all the charts on the panel will be empty.
You can force a database connection on the Dashboard panel's activation by pressing the Settings
button ![]() on the dashboards panel's toolbar and then selecting the Connect to database on activation checkbox.
on the dashboards panel's toolbar and then selecting the Connect to database on activation checkbox.
Detaching charts
If you have several monitors and would like to place a chart on a separate screen, you can either detach the whole Dashboards panel or a single chart, and drag-and-drop them to any place you want.
To detach the whole Dashboard panel, right-click on the dashboard's tab name and select the Detach menu option.
To detach a single chart:
- Double left-click over it.
- Select the View in popup button
 .
.
Changing chart view
You can change the representation of a dashboard and view it as a Pie, Bar, or Time series. To change the dashboard view:
- Right-click on it and select the View as menu option.
Press the Settings button
 located on the chart panel's
toolbar and select the View menu option.
Copying chart to clipboard
To copy a chart onto the clipboard, right-click on the chart and use the Copy to Clipboard menu option. The screenshot of the dashboard will be placed onto the clipboard.
Saving charts
If you want to save a screenshot of a chart locally in PNG format, right-click on it and select the Save as...
option in the context menu displayed.
Printing charts
If you want to print out a screenshot of a dashboard, right-click the dashboard to be printed and select the Print... option.
Zooming
For Time series and Bar chart representations, the following zooming options are available on the dashboard's context menu:
- Zoom In
- Zoom Out
Zoom Reset
Managing charts
You can extend the list of predefined default dashboards by creating your own custom dashboards. This section describes dashboards' list management.
Creating charts
You can create a new custom dashboard either from scratch or from any existing dashboards.
To create a chart from scratch
- Press the Settings button
 on the Dashboards panel toolbar.
 - In the opened dialog box, click the Manage charts... button.
- In the Manage dashboards window, click the New chart... button.
- Set up all configuration parameters as required and press OK.
Tip: To learn more about the chart's configuration parameters, see Adjusting chart Configuration.

To create a chart from a template
- Press the Settings button
 on the Dashboards panel toolbar.
 - In the opened dialog box, click the Manage charts... button.
- In the Manage dashboards window, select any of the existing charts from the list and click Copy.
- Adjust all configuration parameters as required and press OK.
Editing charts
If you need to change the chart's name, ID, or any other configuration setting, you can edit a chart.
Note: Only custom charts can be edited.
To edit a chart's configuration
- Press the Settings button
 on the Dashboards panel toolbar.
 - In the opened dialog box, click the Manage charts... button.
- In the Manage dashboards window, select any of the custom charts from the list and click Edit....
- Adjust all configuration parameters as required and press OK.
Deleting Dashboards
Note: Predefined charts cannot be deleted, but any custom dashboards can be deleted.
If you want to delete a dashboard, follow the steps described below.
To delete a dashboard
- Press the Settings button
 on the Dashboards panel toolbar.
 - In the opened dialog box, click the Manage charts... button.
- In the Manage dashboards window, select any of the custom charts from the list and click Delete.
Managing web-based dashboards
Web charts
DBeaver allows the integration of custom web-based charts into your dashboards, enabling a flexible way to display data from any accessible URL.
To add a web chart to a dashboard, follow these steps:
- Click on the arrow next to the Open Dashboard button
 on the top
toolbar, and select new project dashboard.
Note The toolbar is customizable. For further information, refer to Toolbar Customization article.
- In the new dashboard, navigate to Add chart -> Manage charts.
- Choose Web and click on the New chart button.
- You will be prompted to enter ID, Name, Description and the URL of the Web chart.
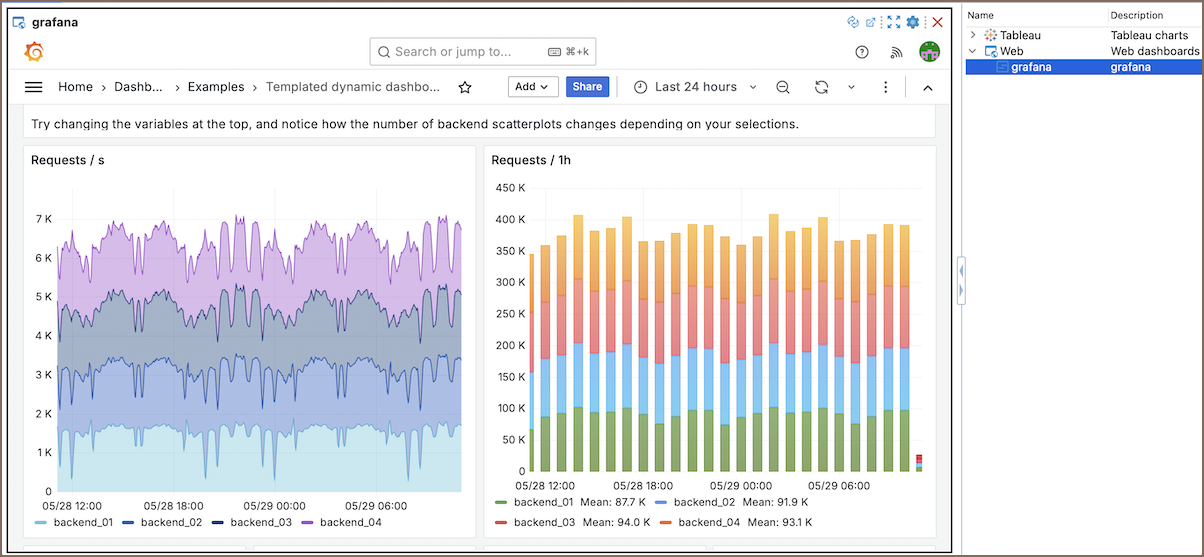
Tip: The URL can point to any web-hosted visualization tool, such as Grafana pages with specific metrics. You can also use DBeaver's pre-configured variables in the URL. For more information on existing variables, see the Pre-configured variables article.
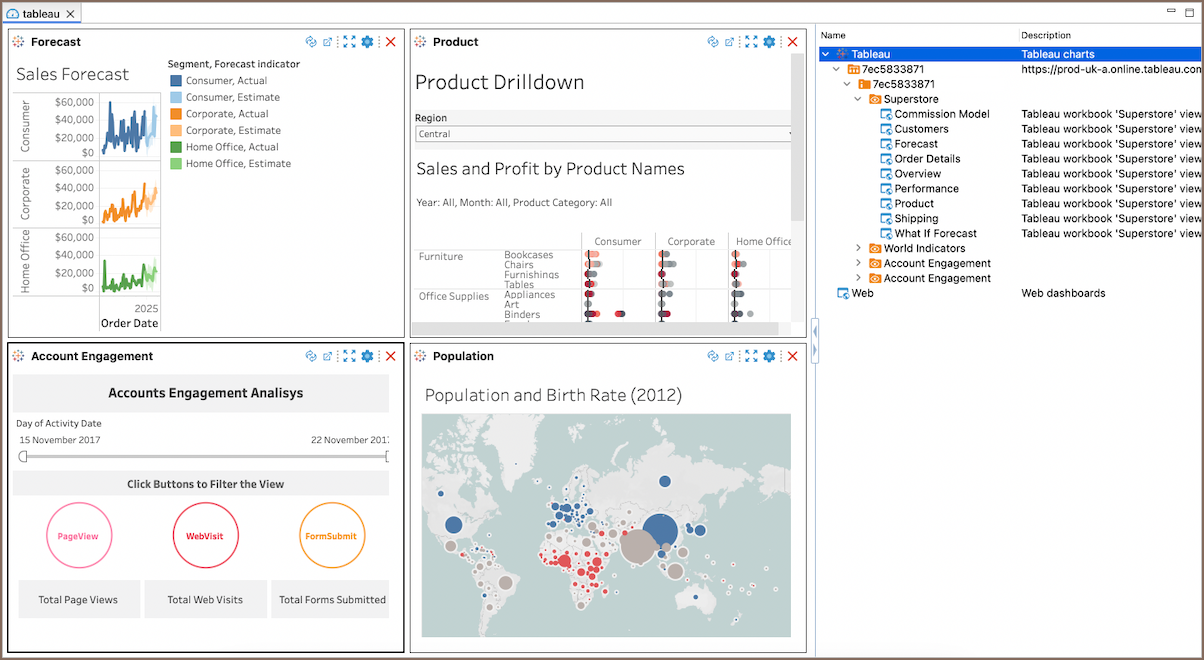
Tableau charts
DBeaver supports integrating Tableau charts for enhanced data visualization.
Note: You must be logged into your Tableau account through DBeaver. For more details on setting this up, see our article.
To access and use Tableau charts, follow these steps:
- Click on the arrow next to the Open Dashboard button
 on the top
toolbar, and select new project dashboard.
 - Enter a Name and ID for your dashboard; this will open the Dashboard panel.
- On the right side of the Dashboard panel, Tableau charts will be available in a dropdown menu.
- Select the desired chart and either drag it to the left side of the Dashboard panel or double-click on the chart to add it.
